Updates and Announcements

Product updates and insights from the Inspectlet team.

March 26, 2026 product updates

Ask Inspectlet AI — Your AI Analyst for User Behavior

Answering questions about user behavior has always been harder than it should be. Which pages have the most frustrated users? Why is signup conversion dropping? What are mobile visitors actually doing on the site? Getting answers used to mean exporting data, building filters, cross-referencing tools, and watching recordings until you stumbled on something useful.

Today we're launching Ask Inspectlet AI — a conversational AI analyst that lets you ask questions about your users in plain English and get instant, data-backed answers.

Just Ask

Type a question. Get an answer. That's it.

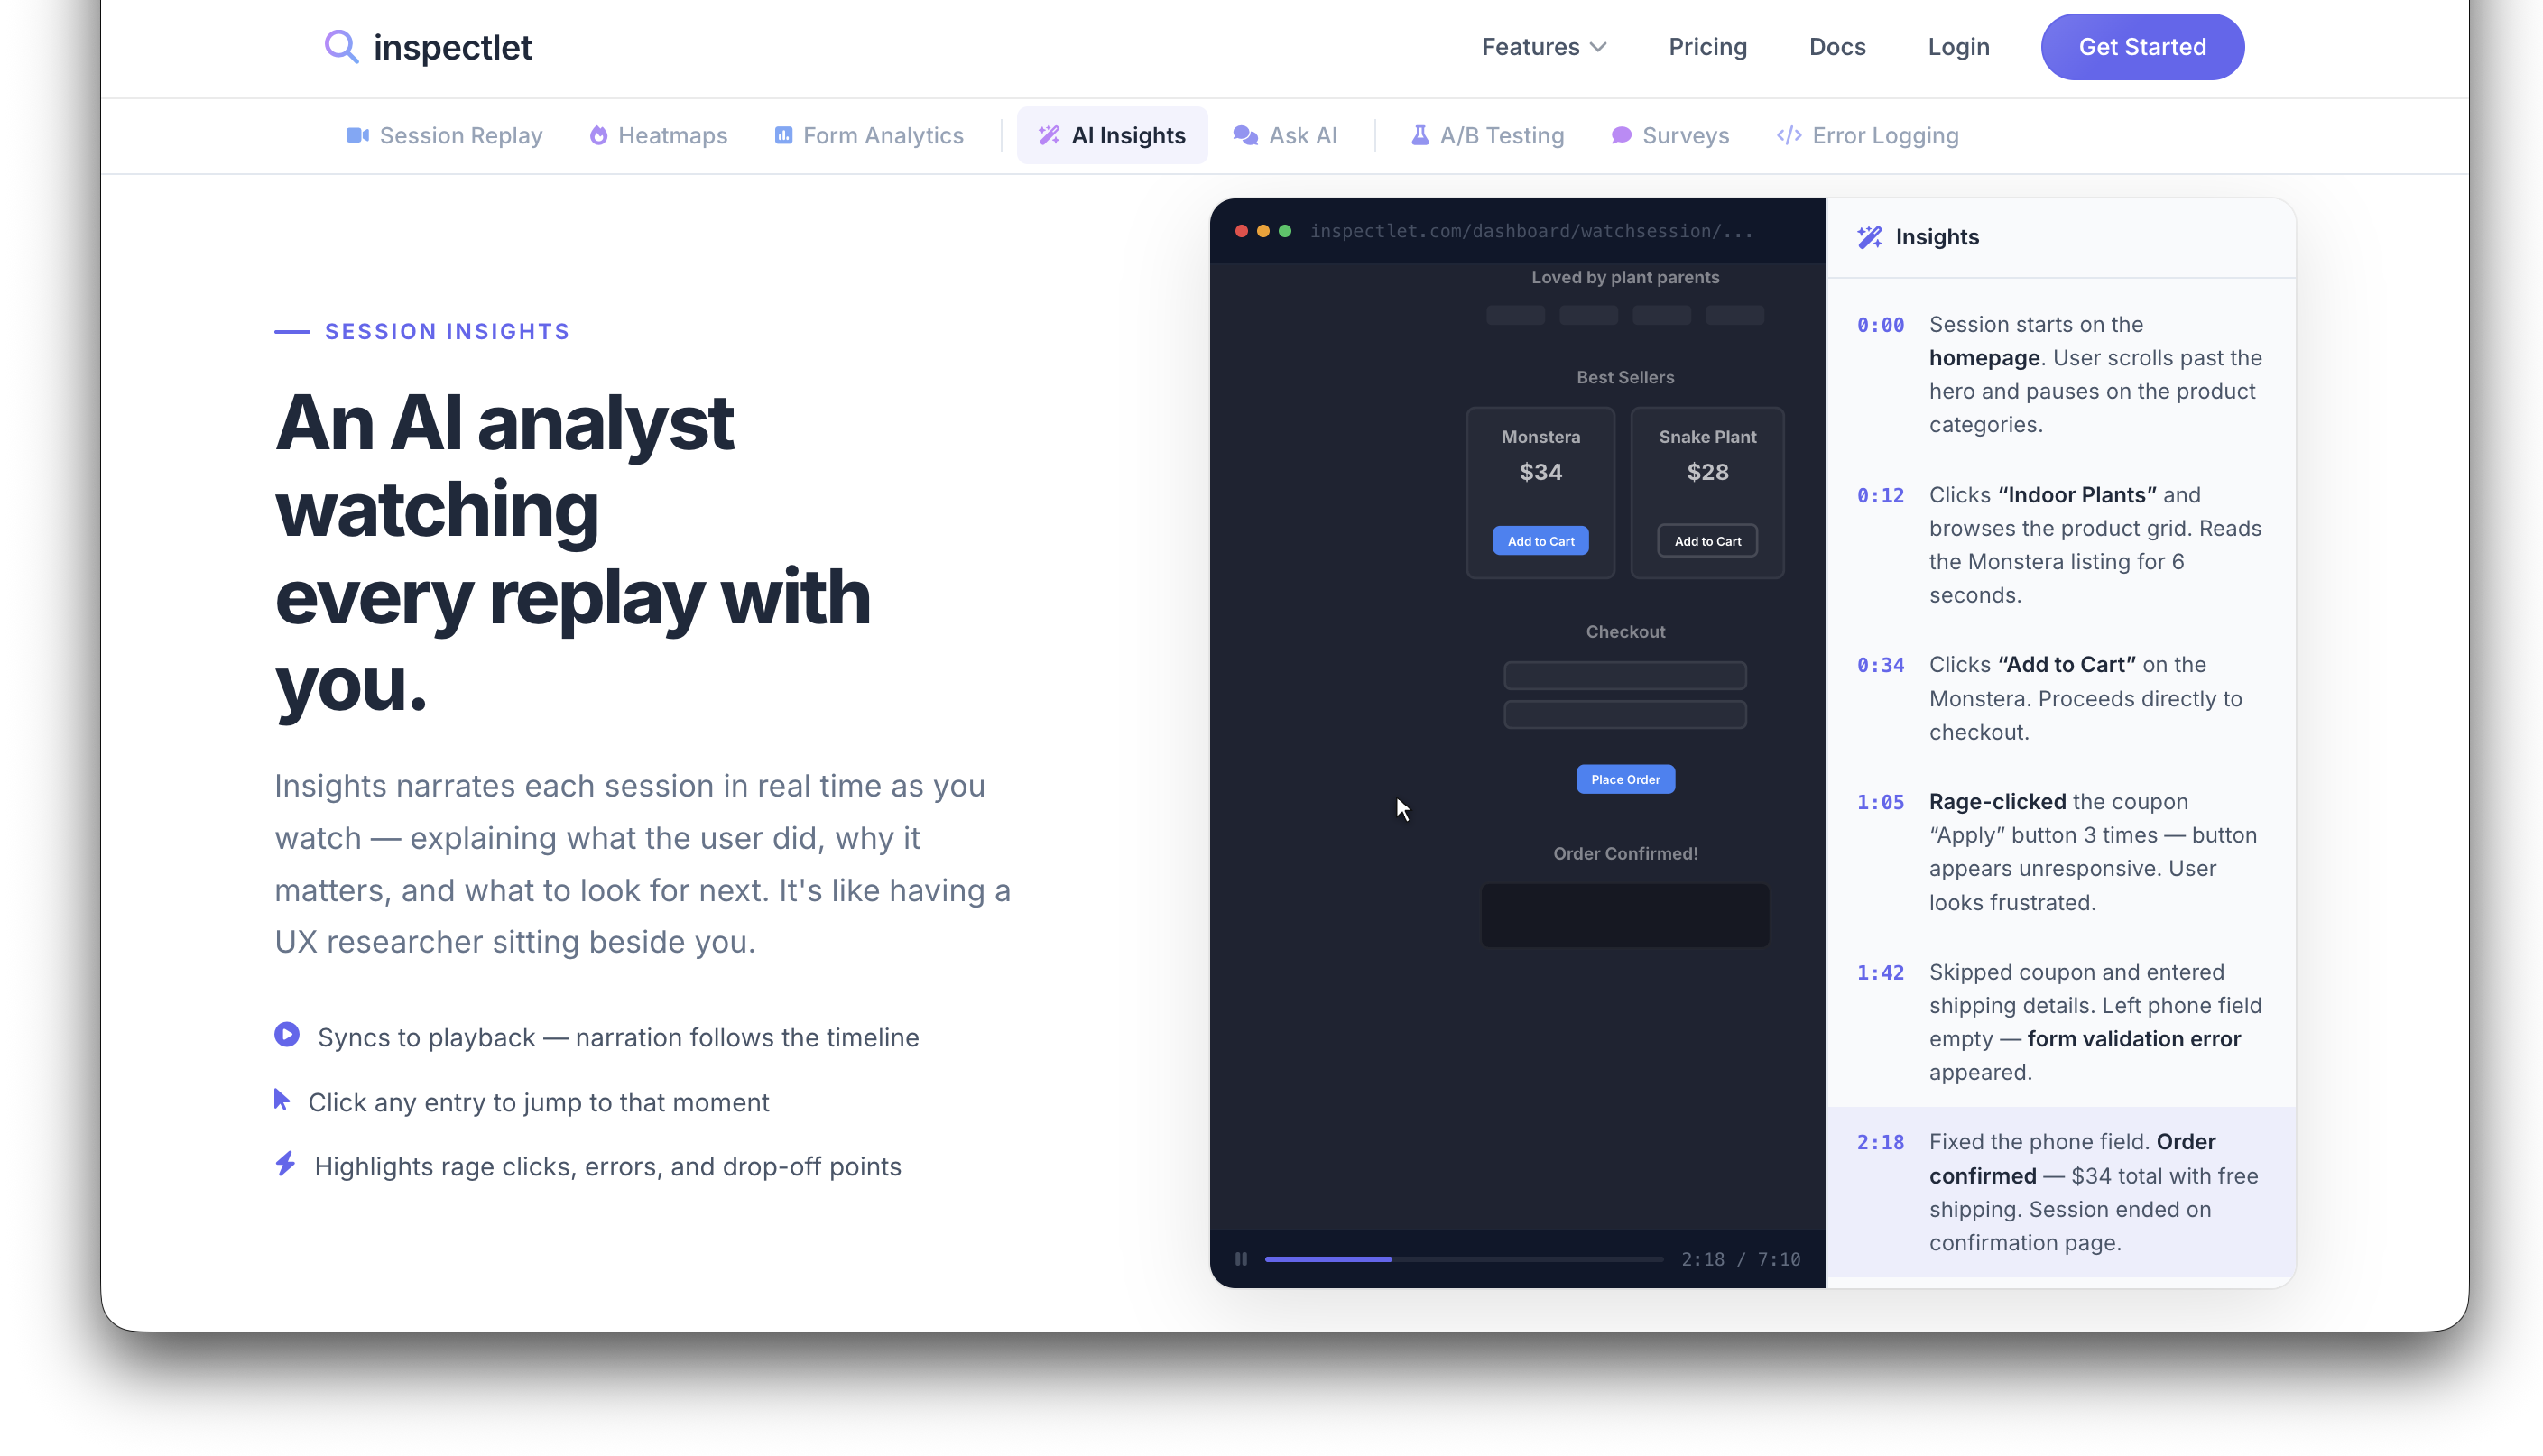
Ask Inspectlet AI understands natural language, so you don't need to know query syntax, build custom reports, or set up filters. You ask a question the way you'd ask a colleague, and the AI searches your analytics data in real time, runs the analysis, and streams the results back — complete with formatted tables, dimensional breakdowns, and direct links to relevant session recordings.

Ask Inspectlet AI interface showing a question about rage click rates with a formatted data table response

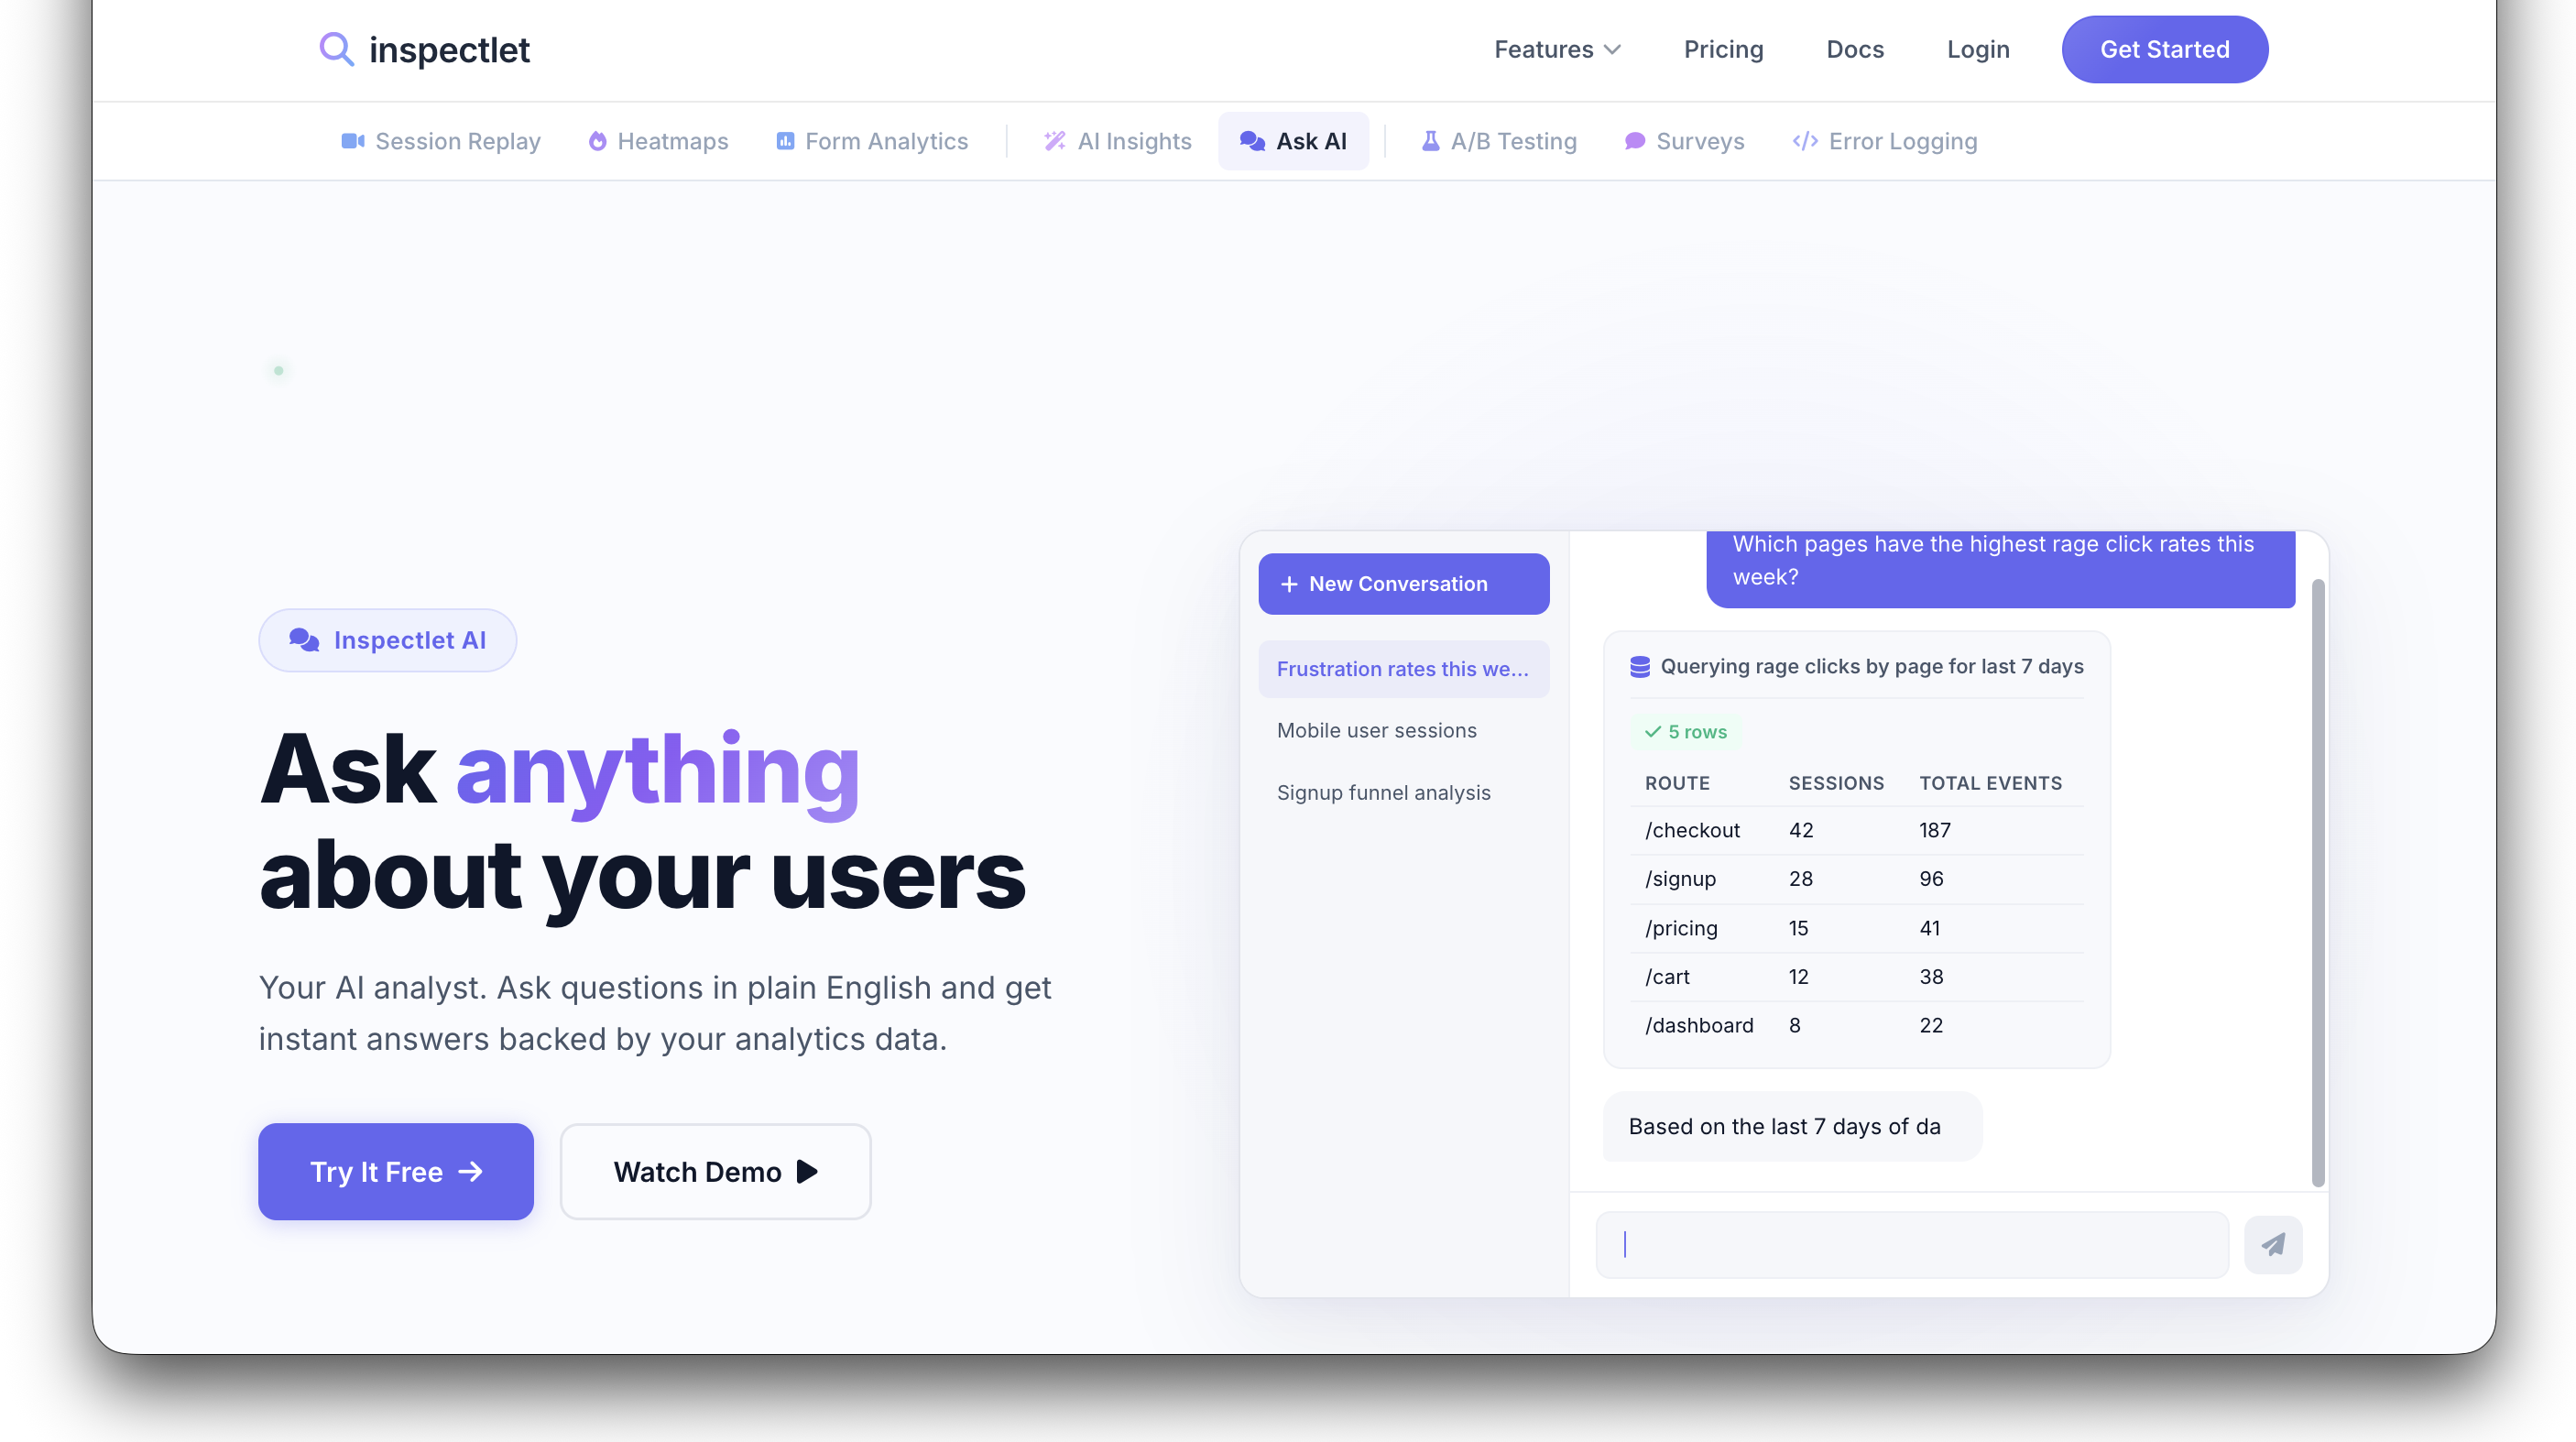
Ask "Which pages have the highest rage click rates this week?" and you get a table of pages ranked by rage clicks, with session counts and total events. Ask "Compare mobile vs desktop engagement this month" and you get a side-by-side breakdown. The answers aren't canned — they're generated live from your actual data.

Multi-Step Reasoning

What makes this more than a search box is the AI's ability to chain multiple lookups into a single response. It doesn't just answer the surface question — it digs deeper.

Ask "Show me sessions where users rage-clicked the Place Order button" and the AI will:

  1. Search your session data for rage clicks on that specific element
  2. Return a table of matching sessions with click counts and durations
  3. Provide direct links to watch each session replay
  4. Analyze the pattern across sessions and explain what's likely going wrong
Ask Inspectlet AI showing multi-step analysis of rage clicks on a Place Order button, with session links and pattern analysis

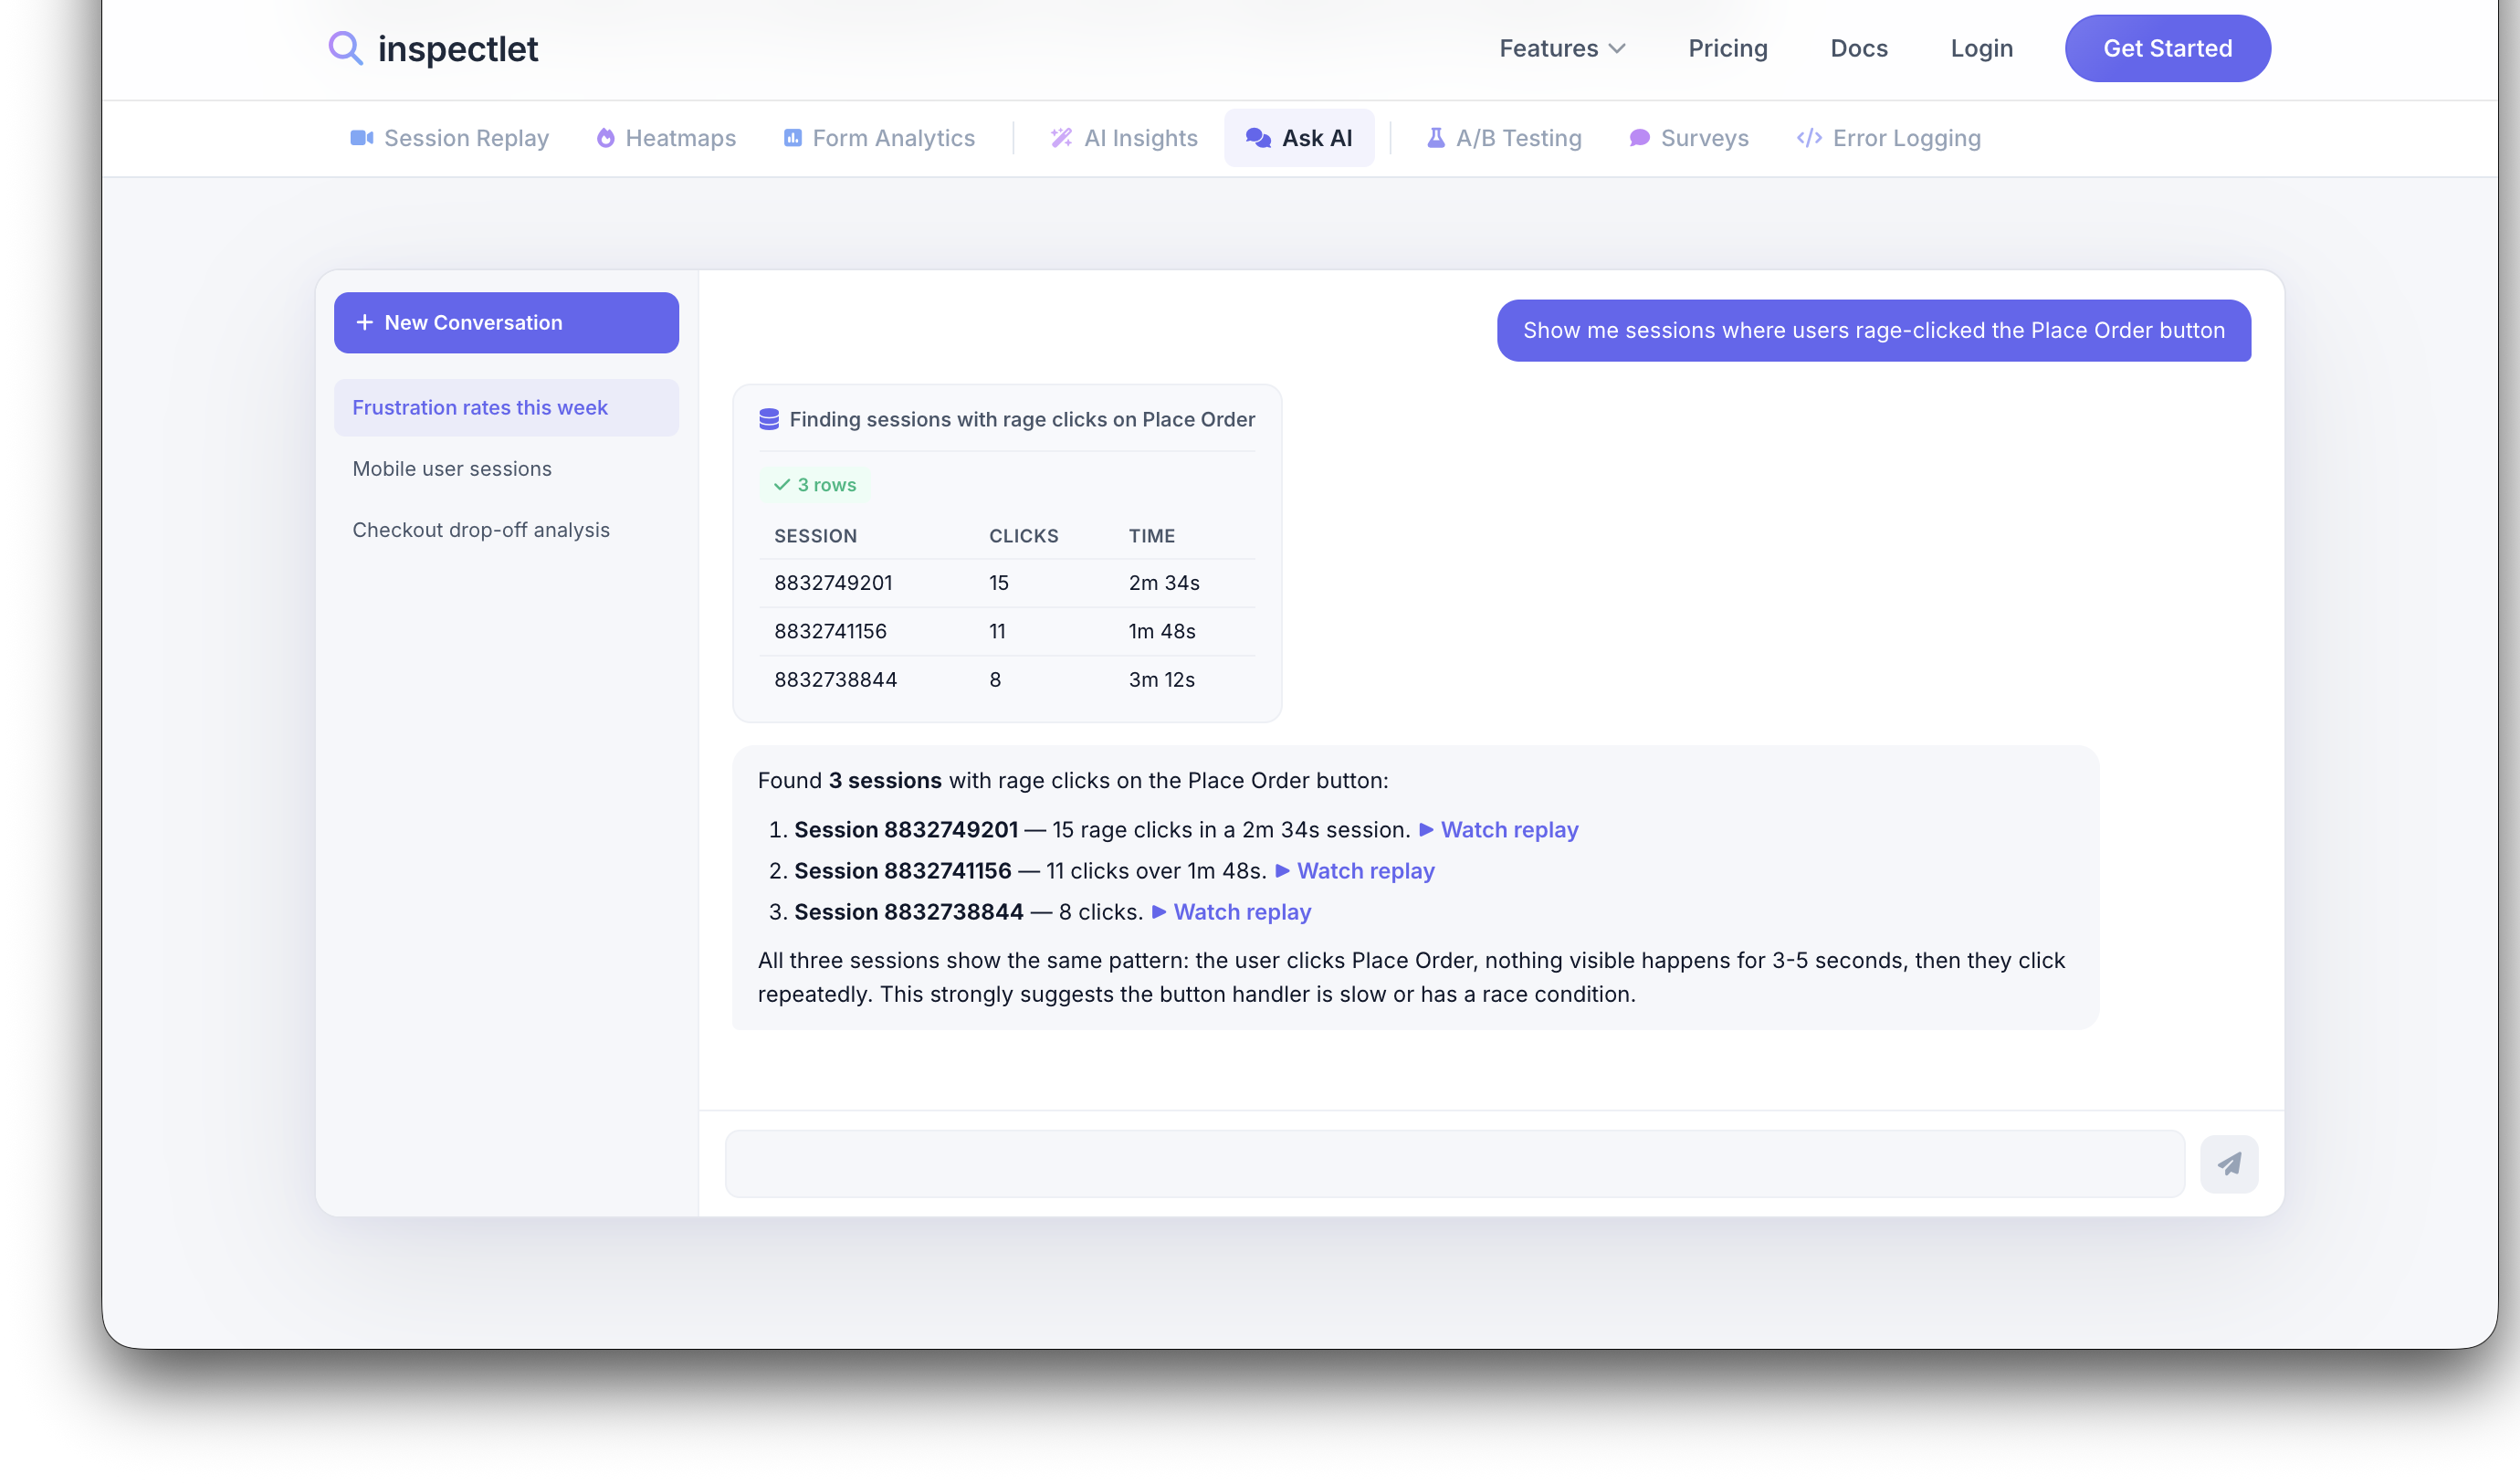
That last part is key. The AI doesn't just hand you raw data — it reads the pattern and tells you what it means. In the example above, it noticed that all three sessions showed the same behavior: the user clicks Place Order, nothing visible happens for 3-5 seconds, then they click repeatedly. Its conclusion: the button handler is slow or has a race condition. That's the kind of insight that would take a human analyst an hour to piece together.

What You Can Ask

The range of questions is broad. Here are some real examples:

  • "Which pages have the highest rage click rates?" — Surface UX friction across your entire site
  • "Show me frustrated sessions from mobile users this week" — Filter by device, timeframe, and behavior
  • "What's the most common user flow on my site?" — Understand navigation patterns
  • "Are there any conversion funnel drop-offs?" — Spot where users abandon key flows
  • "What are visitors from Germany doing on my site?" — Segment by geography
  • "Watch session 1234567 and tell me what happened" — The AI will narrate a specific recording and summarize the user's experience
  • "Why is my signup conversion dropping?" — Open-ended diagnostic questions that the AI breaks down into concrete findings

You can also ask follow-up questions. The AI maintains context within a conversation, so you can drill from a broad overview into specific sessions without starting over.

Session Recording Analysis

One of the most powerful capabilities is the AI's ability to "watch" session recordings and provide a narrated summary. Ask it to analyze a specific session and it will describe what the user did, where they struggled, and what stands out — without you having to watch the full recording yourself.

This is especially useful for triaging. When your dashboard shows dozens of flagged sessions, you can ask the AI to summarize a few before deciding which ones are worth watching in full.

Every Conversation Is Saved

Every conversation with Ask Inspectlet AI is automatically saved, so you can revisit past findings, pick up where you left off, or share a conversation thread with your team. Your analysis history becomes a living record of what your team has investigated and discovered.

Getting Started

Ask Inspectlet AI is available now. If you have an Inspectlet account, you can start asking questions immediately — no additional setup or configuration needed.

Try Ask Inspectlet AI or visit the feature page for a closer look at how it works.

Permalink →
March 12, 2026 product updates

Introducing AI Session Insights — Let AI Find the Sessions That Matter

You record thousands of sessions every week. How many do you actually watch?

For most teams, the answer is almost none. Session replay is one of the most powerful tools in a product team's arsenal — but the sheer volume of recordings makes it practically impossible to find the ones that matter. The user who rage-clicked your checkout button, the error that killed a conversion, the moment someone gave up on your onboarding flow — those signals are in your recordings. You just can't find them manually.

Today we're launching AI Session Insights, a new feature that changes how you use session replay entirely. Instead of you searching for interesting sessions, the AI finds them for you.

AI That Watches Every Session

AI Session Insights runs automatically in the background on every recorded session. Our AI models analyze mouse movements, clicks, scrolls, page transitions, errors, and timing patterns — then score and rank each session by how interesting it is.

The most noteworthy sessions surface to the top of your dashboard, each tagged with exactly why it was flagged. You know what to look for before you press play.

No filters to configure. No events to tag. No rules to write. Install Inspectlet, and the AI starts working on day one.

Real-Time Narration During Playback

This is the part that feels like magic.

When you open a session recording, Insights narrates what's happening in real time as you watch — explaining what the user did, why it matters, and what to look for next. It's like having a senior UX researcher sitting beside you, pointing things out.

AI Session Insights narrating a session replay in real time, showing timestamped entries alongside the session playback

The narration syncs to the playback timeline. Click any entry to jump straight to that moment in the recording. Rage clicks, errors, and drop-off points are highlighted automatically so you never have to scrub through minutes of routine browsing to find the 10-second problem.

What the AI Detects

Every signal is analyzed automatically across every session. No configuration, no guesswork.

Rage clicks — Repeated, frustrated clicking on elements that don't respond. One of the strongest signals that something is broken or confusing in your UI.

Error sessions — JavaScript errors, failed API calls, and console warnings that directly impacted the user's experience.

Conversion drop-offs — Users who reached a key step in your funnel — checkout, signup, onboarding — and abandoned before completing it.

Form abandonment — Sessions where users started filling out a form but gave up. The AI identifies exactly which field caused the friction.

Unusual navigation — Visitors who took unexpected paths: back-and-forth loops, dead-end pages, or skipped critical steps in a flow.

Engagement anomalies — Unusually long sessions, rapid scrolling, or deep engagement that stands out from normal behavior patterns.

From Thousands of Sessions to the Ones That Count

Without AI Session Insights, using session replay looks like this: scroll through an endless list of recordings, filter by page URL and hope for the best, watch five-minute sessions to find a ten-second problem, miss the sessions that actually contained the answers, and eventually give up and check recordings once a month.

With AI Session Insights, you open your dashboard to a curated list of high-value sessions. Each one is tagged with a reason — "Rage click on CTA," "Checkout drop-off," "Form abandoned at email." You click, jump straight to the interesting moment, and discover issues you didn't even know to look for. Your daily review takes under five minutes.

It transforms session replay from a reactive tool you use occasionally into a proactive discovery engine your team checks every morning.

Getting Started

AI Session Insights is available now for all Inspectlet plans. There's nothing extra to install or configure — if you already have Inspectlet's tracking code on your site, recommended sessions will start appearing on your dashboard automatically.

For a deeper look at how it works, visit the AI Session Insights feature page.

Permalink →
January 26, 2026 product updates

Share Session Recordings with One Click

Watching a session recording and spot something your team needs to see? Now you can share it instantly.

One Click, One Link

From any session playback page, hit Copy Share Link and you've got a shareable URL ready to paste into Slack, email, a Jira ticket, or wherever your team communicates. Recipients can watch the full recording immediately — no login required.

This is the kind of feature that sounds small but changes how your team works with session data day-to-day.

Starts Right Where You Are

The share link doesn't just drop someone at the beginning of a 10-minute recording and make them scrub through it. It starts playback at the exact page you're currently viewing. Found a confusing interaction on the checkout page three minutes into a session? The link takes your teammate right there.

No more "skip to 3:14 and watch what happens." The context is built into the link.

Who It's For

Support teams — When a user reports a bug, find the session, grab the link, and attach it to the ticket. The engineer who picks it up can see exactly what happened without back-and-forth.

Product managers — Share recordings in sprint reviews or stakeholder updates to show real user behavior. A 30-second clip of a user struggling with a flow is more persuasive than any slide deck.

Designers — Send recordings to teammates during design reviews. Instead of describing a UX issue, show it.

Agencies and consultants — Share recordings with clients to illustrate findings from UX audits. Clients don't need an Inspectlet account to watch.

How It Works

  1. Open any session recording in the playback page
  2. Navigate to the moment or page you want to highlight
  3. Click Copy Share Link
  4. Send the link to anyone

That's it. The recipient sees the recording in a clean playback view, starting right where you intended.

Permalink →
January 4, 2026 product updates

Network Request Recording, JavaScript Error Logging, and Deep Stack Traces

When something goes wrong on your website, piecing together what happened can feel like detective work. A user reports a broken checkout flow. Your error tracking tool shows a cryptic stack trace. Your server logs show a 500 error — but from which request? And what was the user doing when it happened?

Today we're closing that gap with three powerful new capabilities: automatic XHR network request recording, JavaScript error logging with deep stack traces, and full integration with session replay so you can see the complete picture.

Automatic Network Request Recording

Inspectlet now automatically captures every XHR and fetch request that happens during a user's session. For each request, you get:

  • URL and method — the exact endpoint that was called
  • Status code — instantly see failed requests (4xx, 5xx) at a glance
  • Request latency — how long each request took to complete
  • Response data — the full response body, when you choose to enable it
  • Timing in the session — exactly when each request fired relative to the user's actions

This means you can open any session recording and see a full timeline of every API call alongside the user's clicks, scrolls, and page navigations. No more cross-referencing server logs with session timestamps. It's all in one place.

Network requests panel showing XHR requests with status codes and latency

Why This Matters

Modern web apps are heavily dependent on API calls. A page might look perfectly fine visually, but if a critical XHR request fails silently in the background, the user's experience can fall apart — items don't add to cart, search results don't load, or form submissions vanish into the void.

With network request recording, these invisible failures become visible. You can filter sessions by failed requests, spot patterns in slow API responses, and understand exactly how your backend performance impacts real users.

JavaScript Error Logging with Deep Stack Traces

Inspectlet now monitors and collects every JavaScript error that occurs on your site. But we didn't stop at basic error messages — each error comes equipped with deep stack traces that show you the full chain of function calls that led to the failure.

Error logging panel showing JavaScript errors with full stack traces

For every error, you'll see:

  • Error type and messageTypeError, ReferenceError, unhandled promise rejections, and more
  • Full stack trace — pinpoint the exact file, line, and function where things went wrong
  • Frequency and impact — how many sessions are affected by each error
  • Browser and device context — which environments trigger the error most

From Error to Root Cause in Minutes

Here's where things get really powerful. Traditional error tracking tools tell you that an error happened and give you a stack trace. But they can't show you why the user ended up in that error state. Was it a specific sequence of clicks? A race condition triggered by fast navigation? A form submitted with unexpected data?

With Inspectlet, every error is linked directly to the session recording where it occurred. Click on any error and you can watch the user's entire visit — every click, every scroll, every page transition — leading up to the exact moment the error fired. You're not just reading a stack trace; you're watching the bug happen in real time.

Connecting the Dots: Network Requests + Errors + Session Replay

These features are powerful on their own, but they're transformative together. Consider a common debugging scenario:

  1. A user clicks "Place Order" on your checkout page
  2. An XHR request fires to /api/orders — you can see it in the network panel
  3. The server returns a 422 Unprocessable Entity with validation errors
  4. Your frontend JavaScript throws an unhandled error trying to parse an unexpected response
  5. The user sees a blank screen and leaves

Without Inspectlet, you'd need to correlate timestamps across your error tracker, your server logs, and maybe your analytics tool to reconstruct this story. With these new features, you open one session recording and see the entire narrative: the user's actions, the network request, the server response, the JavaScript error, and the user's reaction — all on a single timeline.

Getting Started

These features are available now for all Inspectlet plans. Network request recording and JavaScript error logging are enabled by default — there's nothing extra to install or configure. If you already have Inspectlet's tracking code on your site, you're already capturing this data.

To view network requests and errors for a session, open any recording and look for the new Network and Errors tabs in the session player.

Response body recording is opt-in for privacy reasons — you can enable it in your site settings when you need the full picture.


These are features we've wanted to build for a long time, and we're excited to see how they change the way you debug and optimize your sites. As always, if you have questions or feedback, we'd love to hear from you.

Permalink →
July 3, 2025 product updates

Add Other Full Account Users with Read/Write Access

By popular demand: you can now add other full account users to your Inspectlet account.

What's New

From the Account Settings page, you can now invite teammates as full account users. Anyone added this way gets complete read and write access to every site in your account — they can view recordings, manage settings, create experiments, set up notifications, and everything else you can do.

Why This Matters

Up until now, sharing access to your Inspectlet data meant sharing your login credentials or relying on screen shares. That's not great for security, and it doesn't scale as your team grows.

With full account users, everyone on your team gets their own login while sharing the same account and data. No more credential sharing, no more asking a colleague to look something up for you.

Use Cases

Growing teams — As your product, engineering, or UX team scales, new members can be onboarded to Inspectlet in seconds. Add them from Account Settings and they're in.

Cross-functional collaboration — Give your designers, product managers, and engineers direct access to session recordings and analytics. When everyone can explore the data themselves, decisions get made faster.

Agency and client setups — If you manage Inspectlet for multiple stakeholders, you can now grant access to the people who need it without handing over account ownership.

How to Add Users

  1. Go to Account Settings
  2. Find the user management section
  3. Invite a new user by email
  4. They'll receive an invitation and can set up their own credentials

Full account users have the same level of access as the account owner across all sites. This is ideal for trusted teammates who need unrestricted access to your analytics data.

Permalink →
December 5, 2024 product updates

CSV Export Now Available for Session Searches

Sometimes you need your session data outside of Inspectlet — in a spreadsheet, a report, or piped into another tool. Now you can get it there with one click.

Export Any Search as CSV

From the Session Recordings tool, run any search or apply any filters to find the sessions you're interested in, then click Export Results. Inspectlet will generate a CSV file containing the data for all matching sessions, ready to open in Excel, Google Sheets, or any other tool that handles CSV.

What's Included

The export captures the key data points for each matching session, giving you a structured dataset you can sort, filter, pivot, and chart however you need. This is the same data you see in the session list, but in a format that's easy to work with outside of the Inspectlet dashboard.

Practical Uses

Reporting — Pull session data into a spreadsheet to build reports for stakeholders. Summarise session counts by date, page, browser, or any other dimension.

Cross-referencing — Export sessions and match them against data from your CRM, analytics platform, or support tool. If you're investigating a spike in support tickets, correlate those tickets with session data to find patterns.

Bulk analysis — When you need to look at hundreds or thousands of sessions in aggregate, a spreadsheet is often the fastest way to spot trends. Sort by duration, filter by entry page, or group by device type to surface insights quickly.

Archiving — Keep a local record of session search results for audits, compliance, or historical reference.

How to Export

  1. Go to Session Recordings
  2. Apply your desired filters (date range, pages, events, tags, etc.)
  3. Click Export Results
  4. Open the downloaded CSV in your tool of choice

It works with any combination of filters, so you can export everything from "all sessions this month" to "sessions on the checkout page that contained a rage click event."

Permalink →
June 18, 2024 product updates

See Geolocation During Session Playback

A quick but useful update: you can now see geolocation information about the user directly on the session playback page.

Location Context at a Glance

When you're watching a session recording, you'll now see where the visitor was browsing from — country, region, and city — right alongside the session details. It's a small addition, but it adds a layer of context that can make a real difference when reviewing sessions.

When Location Matters

Localisation issues — Watching a user struggle with a form? Their location might explain why. Date formats, address fields, currency display, and language settings all vary by region. Seeing that a confused user is browsing from Germany or Japan can immediately point you toward localisation as the root cause.

Regional performance — If a session feels sluggish, geolocation can help you correlate that with server distance or CDN coverage. A user in Southeast Asia might have a very different experience from one in North America, and now you can see that context without leaving the playback page.

Market research — Understanding where your most engaged users (or most frustrated users) are located helps inform product and marketing decisions. You might discover that a feature you thought was niche is heavily used in a specific region.

Fraud and anomaly detection — Location data helps flag sessions that look suspicious. If a logged-in user's session suddenly originates from a country they've never visited, that's worth investigating.

Always There When You Need It

Geolocation data appears automatically on the playback page for all recorded sessions — there's nothing to enable or configure. It's simply one more piece of the puzzle when you're trying to understand who your users are and what they're experiencing.

Permalink →
February 21, 2024 product updates

Run A/B Tests on Your Website with Inspectlet

We're excited to announce that you can now run A/B tests directly inside Inspectlet. Create experiments, modify your pages with a visual editor, and measure the impact on the metrics that matter most to your business — all without writing a single line of code.

What Is A/B Testing?

A/B testing (also known as split testing) is a controlled experiment that compares two versions of a webpage. Half of your visitors see the original version of your page (the "control"), and the other half see a modified version (the "variation"). By measuring how each group performs against your goals — like signup rate, revenue per visitor, or click-through rate — you can empirically determine which version works best and quantify exactly how much better it is.

No more guessing whether that new headline will improve conversions. No more debating button colors in meetings. A/B testing gives you data instead of opinions.

The Visual Editor

Creating an experiment in Inspectlet doesn't require any code changes to your site. Our visual editor lets you point and click to make changes directly on your live webpage:

Inspectlet A/B testing visual editor

You can modify text, swap images, change button styles, rearrange elements, hide sections, or adjust any visible aspect of your page. The visual editor generates the changes automatically — your original page stays untouched, and Inspectlet applies the modifications on the fly for visitors assigned to the variation group.

Measuring What Matters

Every experiment is tied to one or more Goals that define what success looks like. Goals can track actions like:

  • Signups — did the visitor create an account?
  • Purchases — did they complete a transaction?
  • Revenue — how much did they spend?
  • Page visits — did they reach a key page like a pricing or confirmation page?
  • Custom events — any action you're already tracking with Inspectlet
A/B test results showing performance comparison between control and variation

Inspectlet tracks each goal across both groups and presents clear results showing the conversion rate for each version, the improvement percentage, and statistical confidence so you know when you have a winner.

How It Works

  1. Create an experiment — Head to your Dashboard and click A/B Experiments
  2. Set up your variation — Use the visual editor to make changes to your page
  3. Define your goals — Choose which metrics you want to improve
  4. Launch — Inspectlet automatically splits traffic and starts collecting data
  5. Review results — Watch the data come in and see which version wins

You can run unlimited experiments simultaneously, testing different changes on different pages across your site.

A/B Testing + Session Replay: A Powerful Combination

Here's what makes A/B testing inside Inspectlet uniquely powerful: you can watch session recordings of visitors in each test group. Instead of just seeing that Version B had a 15% higher conversion rate, you can watch why. Maybe users in the control group were scrolling past your CTA without noticing it, while users in the variation group engaged with it immediately.

This combination of quantitative data (conversion metrics) and qualitative insight (session replay) gives you a much deeper understanding of what's working and what isn't.

Get Started

To create your first experiment, head to your Dashboard and click A/B Experiments. For a complete walkthrough of setting up experiments, configuring goals, and interpreting results, read the full documentation.

Permalink →
September 3, 2023 product updates

Real-Time Notifications via Email, Slack, and Webhooks

Knowing what's happening on your website shouldn't require you to be logged into a dashboard all day. That's why we've added real-time notifications to Inspectlet — you can now get instantly alerted via email, Slack, or webhooks whenever something important happens on your site.

Get Notified When It Matters

Inspectlet can now push notifications to you in real time based on three types of triggers:

  • Specific actions or events — A visitor completes a purchase, submits a lead form, hits a particular page, or triggers any custom event you're tracking
  • New sessions — A new session is recorded matching your criteria
  • Filtered conditions — Combine triggers with filters to get notified only about the sessions you care about
Inspectlet notifications configuration panel

Three Channels, One Setup

Email

Get notifications delivered straight to your inbox. Great for individual alerts or low-frequency events where you want a record you can refer back to.

Slack

Push notifications directly into a Slack channel so your whole team can see them. This is especially useful for sales teams who want to know the moment a high-value prospect visits the pricing page, or for support teams monitoring for error patterns.

Webhooks

Send a POST request to any URL you specify. Webhooks open up endless possibilities for custom integrations — pipe events into your CRM, trigger internal workflows, log data to a spreadsheet, send an SMS through Twilio, or feed events into any tool your team already uses.

Practical Use Cases

Sales and lead response: Get a Slack notification the instant a visitor submits a demo request form. Your sales team can watch the session replay to understand what the prospect was interested in before reaching out — making for a much more informed first conversation.

Revenue monitoring: Receive an email every time a purchase event fires. Keep a pulse on transactions as they happen without refreshing a dashboard.

Error alerting: Pair notifications with event filters to get alerted when users hit critical error states. Catch issues before they turn into support tickets.

VIP tracking: Set up notifications for sessions that match specific criteria — like visitors from a particular company domain or users who land on your enterprise pricing page.

How to Set It Up

Head to your Dashboard and navigate to the Notifications section. From there you can create notification rules by choosing your trigger (event, action, or new session), setting any filters, and selecting your delivery channel. You can create as many notification rules as you need, each with its own triggers and channels.

Permalink →
May 28, 2023 product updates

Introducing Rage Clicks — Identify User Frustration Automatically

We've all been there. You click a link that isn't actually a link. You tap a button that doesn't respond. You click an image expecting it to enlarge, but nothing happens. So you click again. And again. And again — faster and harder, as if sheer determination will make the interface cooperate.

That's a rage click. And now Inspectlet detects them automatically.

What Is a Rage Click?

A rage click is logged when a user rapidly and repeatedly clicks on a non-interactive area of your page. It's one of the strongest behavioral signals of user frustration, and it almost always points to a UX problem worth fixing.

Here's what a rage click looks like in action:

Animation showing a user rage clicking on a non-interactive element

The rapid-fire clicking pattern is unmistakable — and the frustration behind it is real.

Why Rage Clicks Matter

Rage clicks aren't just an interesting data point. They're a direct window into the moments where your UI is failing your users. Every rage click represents a visitor whose expectations didn't match reality, and each one is an opportunity to improve your site.

The most common causes of rage clicks include:

  • Text that looks like a link but isn't — Underlined or colored text that users assume is clickable
  • Images users expect to enlarge — Product photos, thumbnails, or diagrams that don't respond to clicks
  • Buttons that appear broken — Elements that look interactive but have missing or broken event handlers
  • Slow-loading elements — Users clicking repeatedly because the page hasn't responded yet
  • Confusing UI patterns — Cards, icons, or labels that suggest interactivity but aren't wired up

Each of these is a concrete, fixable problem. And without rage click detection, many of them would go completely unnoticed — users don't file support tickets about dead links or unclickable images. They just leave.

How It Works in Inspectlet

Inspectlet continuously monitors click patterns during every recorded session. When a user's clicking behavior matches the rage click pattern — rapid repeated clicks in the same area of a non-interactive element — it's automatically logged as a session-level event.

This means you can:

  • Filter sessions by rage clicks — On the session recordings page, filter for sessions that contain rage click events to quickly find frustrated users
  • See exactly what triggered the frustration — Watch the full session replay to see the context around each rage click
  • Identify patterns across sessions — Are multiple users rage clicking in the same spot? That's a high-priority fix
  • Track improvement over time — After fixing a UX issue, monitor whether rage clicks in that area decrease

From Detection to Fix

Here's a typical workflow for using rage clicks to improve your site:

  1. Filter your recordings to show only sessions with rage click events
  2. Watch a few of those sessions to identify where the rage clicks are happening
  3. Spot the pattern — you'll often find the same element causing frustration across multiple sessions
  4. Fix the issue — make the element interactive, remove the misleading styling, or add the expected behavior
  5. Verify — check future sessions to confirm the rage clicks have stopped

It's a simple loop, but it's remarkably effective. Rage clicks point you to real problems that affect real users, and fixing them leads to immediate, tangible improvements in user experience.

Getting Started

Rage click detection is automatic — if you have Inspectlet installed, it's already working. Head to your session recordings page and use the event filter to find sessions with rage clicks. For more details, check out the Rage Clicks documentation.

Permalink →