When something goes wrong on your website, piecing together what happened can feel like detective work. A user reports a broken checkout flow. Your error tracking tool shows a cryptic stack trace. Your server logs show a 500 error — but from which request? And what was the user doing when it happened?
Today we're closing that gap with three powerful new capabilities: automatic XHR network request recording, JavaScript error logging with deep stack traces, and full integration with session replay so you can see the complete picture.
Automatic Network Request Recording
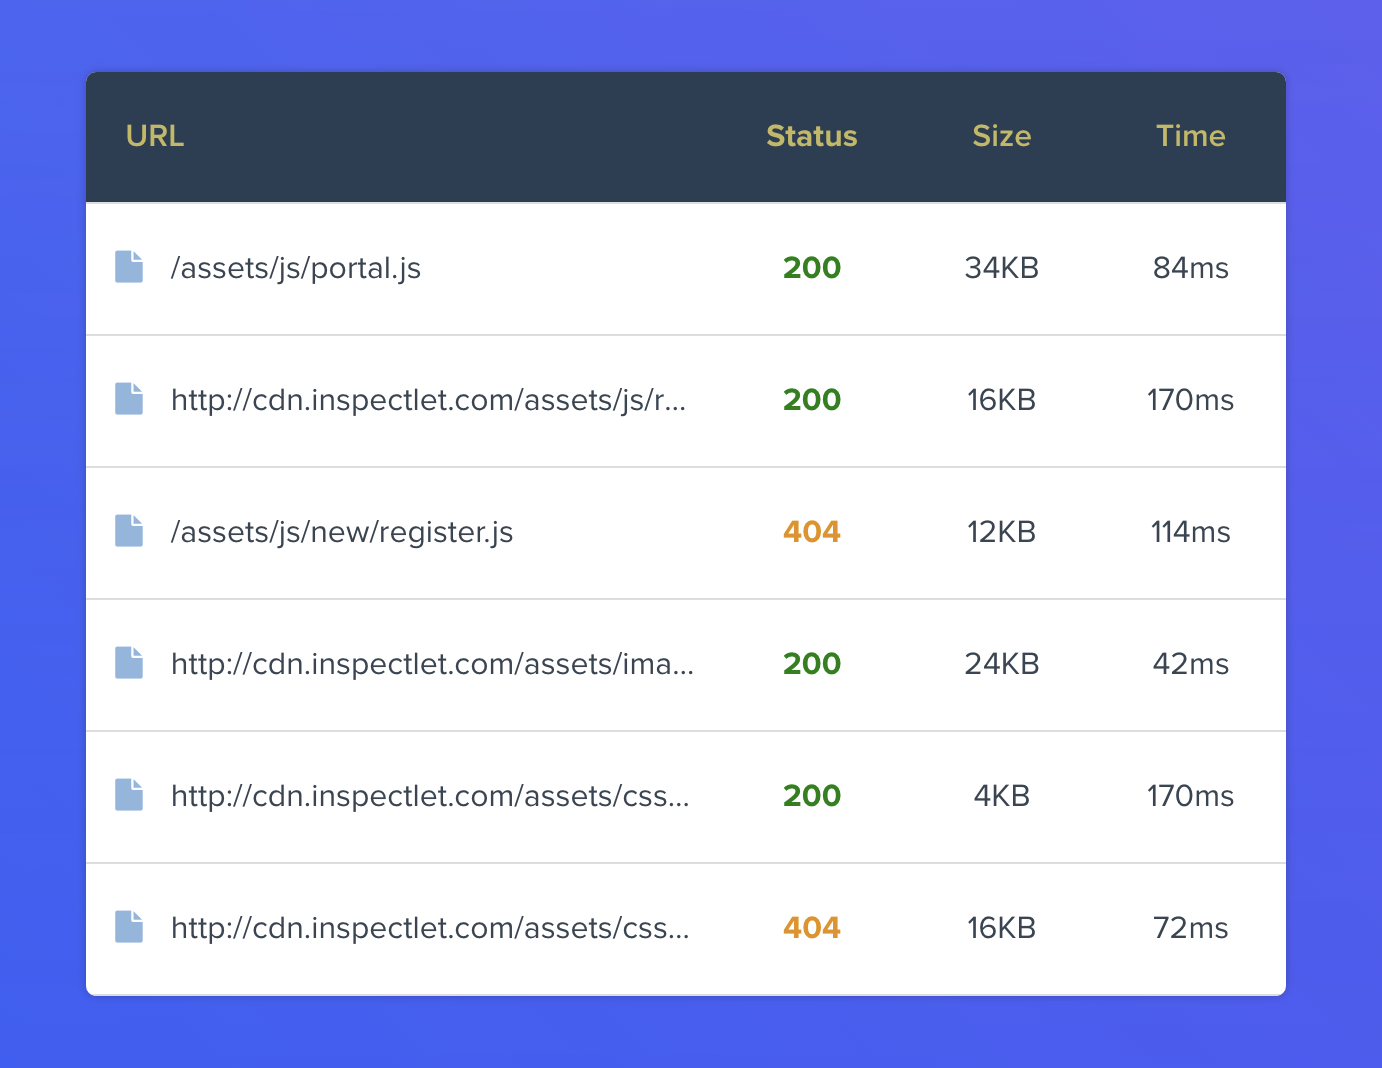
Inspectlet now automatically captures every XHR and fetch request that happens during a user's session. For each request, you get:
- URL and method — the exact endpoint that was called
- Status code — instantly see failed requests (4xx, 5xx) at a glance
- Request latency — how long each request took to complete
- Response data — the full response body, when you choose to enable it
- Timing in the session — exactly when each request fired relative to the user's actions
This means you can open any session recording and see a full timeline of every API call alongside the user's clicks, scrolls, and page navigations. No more cross-referencing server logs with session timestamps. It's all in one place.
Why This Matters
Modern web apps are heavily dependent on API calls. A page might look perfectly fine visually, but if a critical XHR request fails silently in the background, the user's experience can fall apart — items don't add to cart, search results don't load, or form submissions vanish into the void.
With network request recording, these invisible failures become visible. You can filter sessions by failed requests, spot patterns in slow API responses, and understand exactly how your backend performance impacts real users.
JavaScript Error Logging with Deep Stack Traces
Inspectlet now monitors and collects every JavaScript error that occurs on your site. But we didn't stop at basic error messages — each error comes equipped with deep stack traces that show you the full chain of function calls that led to the failure.
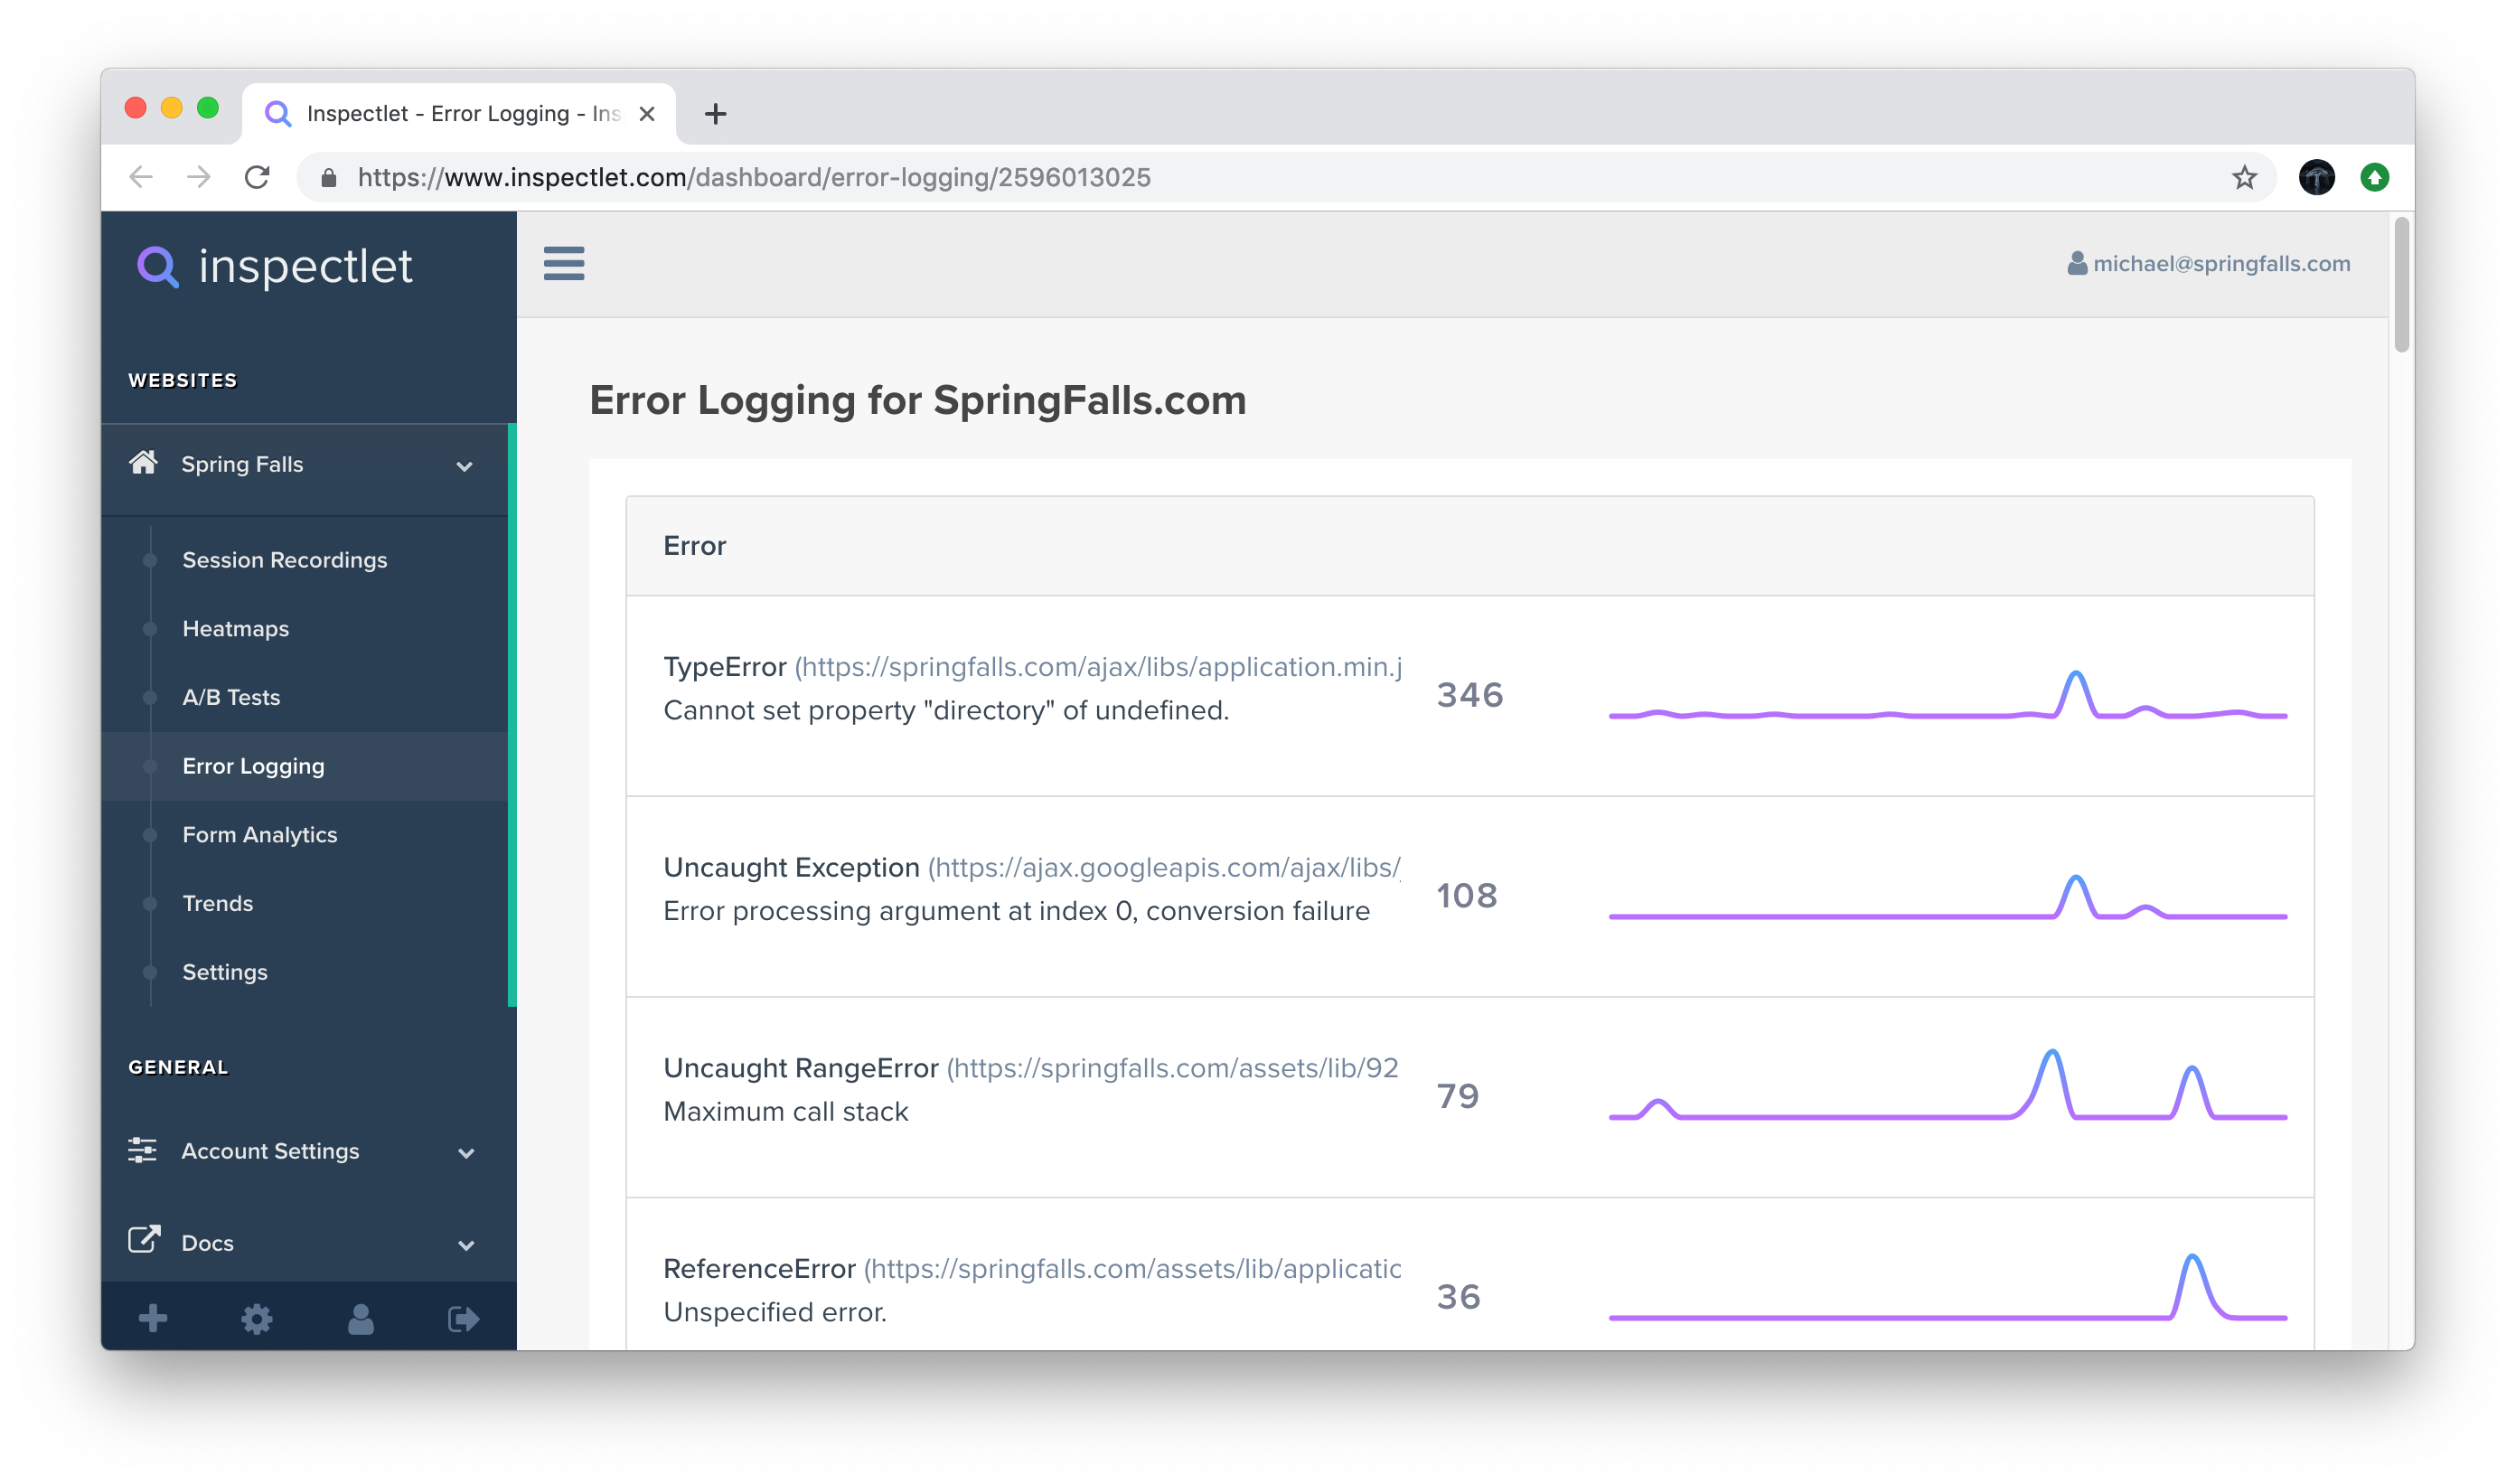
For every error, you'll see:
- Error type and message —
TypeError,ReferenceError, unhandled promise rejections, and more - Full stack trace — pinpoint the exact file, line, and function where things went wrong
- Frequency and impact — how many sessions are affected by each error
- Browser and device context — which environments trigger the error most
From Error to Root Cause in Minutes
Here's where things get really powerful. Traditional error tracking tools tell you that an error happened and give you a stack trace. But they can't show you why the user ended up in that error state. Was it a specific sequence of clicks? A race condition triggered by fast navigation? A form submitted with unexpected data?
With Inspectlet, every error is linked directly to the session recording where it occurred. Click on any error and you can watch the user's entire visit — every click, every scroll, every page transition — leading up to the exact moment the error fired. You're not just reading a stack trace; you're watching the bug happen in real time.
Connecting the Dots: Network Requests + Errors + Session Replay
These features are powerful on their own, but they're transformative together. Consider a common debugging scenario:
- A user clicks "Place Order" on your checkout page
- An XHR request fires to
/api/orders— you can see it in the network panel - The server returns a
422 Unprocessable Entitywith validation errors - Your frontend JavaScript throws an unhandled error trying to parse an unexpected response
- The user sees a blank screen and leaves
Without Inspectlet, you'd need to correlate timestamps across your error tracker, your server logs, and maybe your analytics tool to reconstruct this story. With these new features, you open one session recording and see the entire narrative: the user's actions, the network request, the server response, the JavaScript error, and the user's reaction — all on a single timeline.
Getting Started
These features are available now for all Inspectlet plans. Network request recording and JavaScript error logging are enabled by default — there's nothing extra to install or configure. If you already have Inspectlet's tracking code on your site, you're already capturing this data.
To view network requests and errors for a session, open any recording and look for the new Network and Errors tabs in the session player.
Response body recording is opt-in for privacy reasons — you can enable it in your site settings when you need the full picture.
These are features we've wanted to build for a long time, and we're excited to see how they change the way you debug and optimize your sites. As always, if you have questions or feedback, we'd love to hear from you.